
Measuring Peptide Concentration by UV: When A280 Works—and When It Does Not
UV absorbance at 280 nm can estimate concentration only when the peptide has a suitable, known extinction coefficient and the sample obeys the measurement assumptions. Short peptides with no tryptophan, tyrosine, or disulfide contribution may show little useful A280 signal, so a generic protein setting can produce a misleading number.
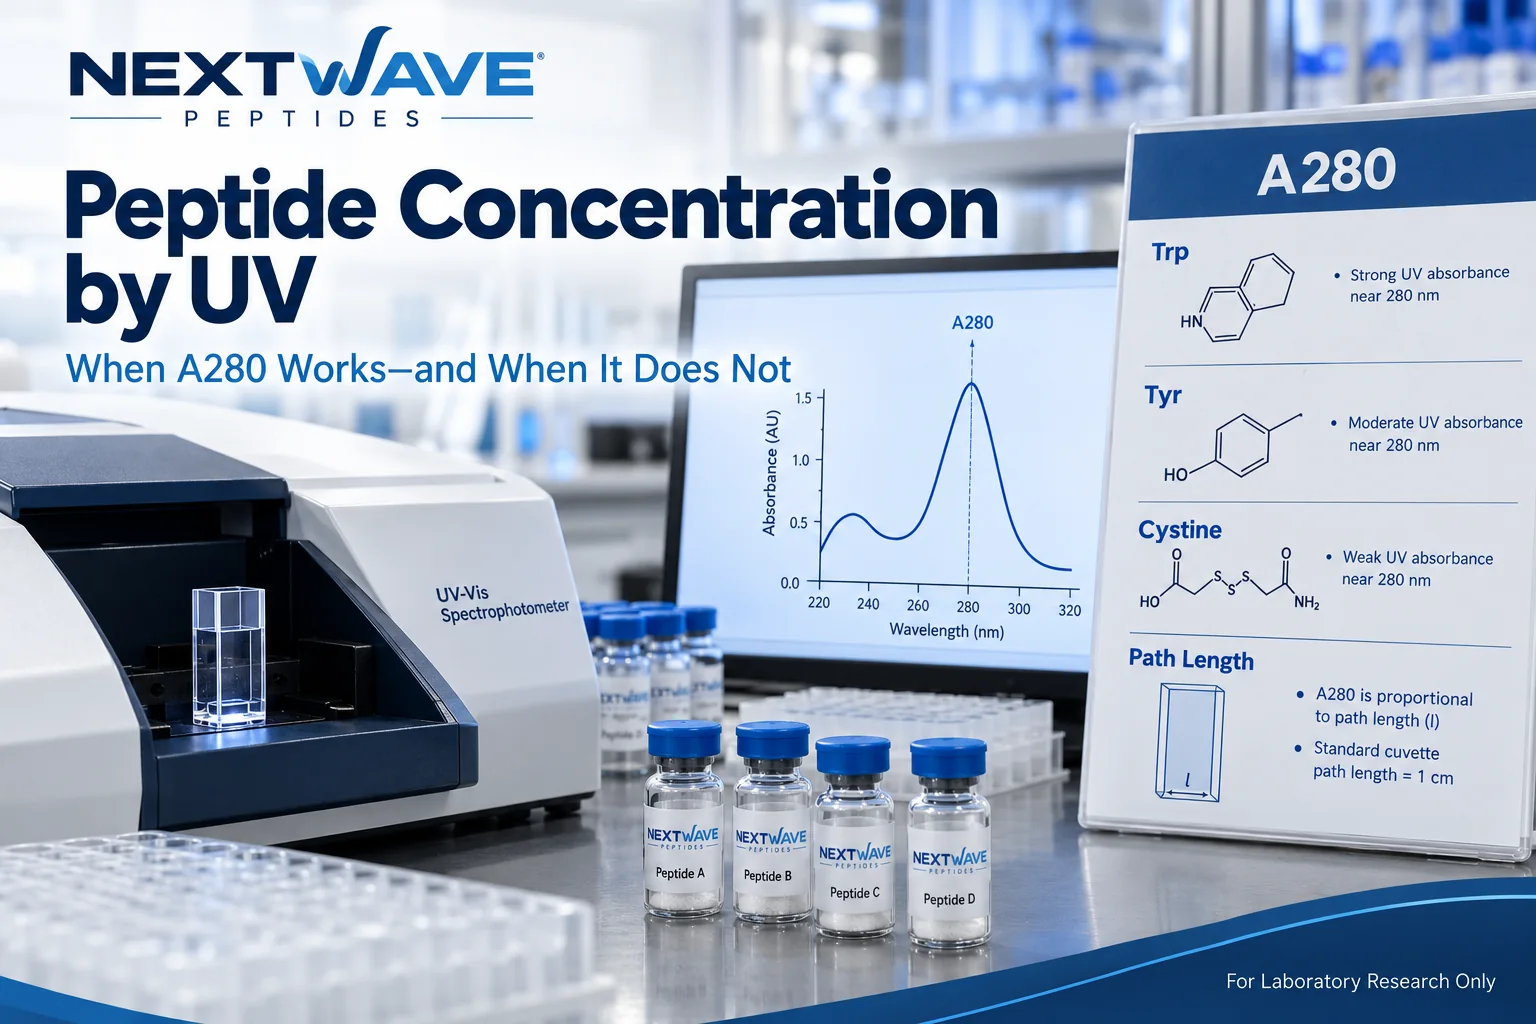
What creates absorbance near 280 nm
The dominant sequence contributions are usually tryptophan and tyrosine, with a smaller contribution from cystine. The classic NIH PubMed extinction-coefficient study evaluated these contributions in proteins and proposed sequence-based estimates, while also concluding that measurement is preferable when accuracy matters. Applying the relationship to a peptide requires the peptide’s exact sequence and disulfide state.
Beer–Lambert analysis relates absorbance to concentration, path length, and molar absorption coefficient. The earlier NIH PubMed sequence-based extinction study explains how amino-acid composition can be used to estimate a coefficient and states the assumptions and limits of that approach. The absorbance equation still does not supply a missing coefficient or correct a contaminated blank.
First ask whether the sequence supports A280
| Sequence feature | Expected A280 contribution | Main caution |
|---|---|---|
| Tryptophan present | Usually strongest common residue contribution | Environment can shift the measured coefficient |
| Tyrosine present | Useful but smaller contribution | Ionization state and solvent can matter |
| Disulfide present | Small cystine contribution | Reduced and oxidized forms differ |
| No Trp, Tyr, or cystine | Often weak A280 signal | Baseline and impurities can dominate |
| Added chromophore or conjugate | Potentially strong signal | Use the conjugate’s verified spectrum and coefficient |
An absorbance value without sequence context is therefore incomplete. The peptide calculation-tools guide explains the parallel arithmetic rule: define the quantity and units before calculating.
Why blank, path length, and scatter matter
The blank should match the sample matrix because buffer components, reducing agents, nucleic acids, and particulates can contribute absorbance or baseline slope. Microvolume instruments infer a short path length, while cuvettes use a stated path; the instrument’s path-length handling must be included in the record.
Aggregation, precipitate, dust, or bubbles can scatter light and raise apparent absorbance. A wavelength scan is more informative than a single number because it can reveal baseline slope and unexpected peaks. Dilution linearity is another useful check, but only if dilution does not change association, solubility, or adsorption.
A280, HPLC purity, and mass are different measurements
A280 estimates concentration under an optical model. HPLC relative peak area describes included detector response under a separation method. Mass spectrometry tests compatibility with molecular composition. None automatically substitutes for the others. The 99% peptide purity article and stereochemistry and mass guide show why the three evidence layers should remain separate.
For practical sequence contrasts, Semax contains phenylalanine but no tryptophan or tyrosine, Semaglutide contains aromatic residues in a different sequence, and AOD-9604 has its own sequence and disulfide state. These records in Research Compounds illustrate why one universal A280 coefficient cannot be assigned across a peptide catalog. The links are identity references, not claims about measured concentration for any lot.
Use the NEXTWAVE PEPTIDES catalog to identify the exact material, then check whether lot documentation reports a quantitative method. If concentration must be established, select and validate a method appropriate to the sequence, matrix, and range rather than forcing every peptide through a generic A280 workflow.
Research limitations
Sequence-based coefficients are estimates derived from defined datasets and conditions. Solvent, pH, conformation, conjugation, oxidation state, turbidity, instrument bandwidth, and path-length calibration can alter results. Very low absorbance magnifies blank and noise errors. A280 does not establish purity, sequence, sterility, or biological activity, and this article does not provide instructions for human use.
Frequently asked questions
Does every peptide absorb at 280 nm?
Every sample may show some baseline signal, but peptides lacking the main 280-nm chromophores often do not provide a selective or sensitive A280 concentration measurement.
Can phenylalanine replace tryptophan in an A280 estimate?
Phenylalanine absorbs mainly at shorter wavelengths and contributes far less near 280 nm, so a protein-style A280 method may be unsuitable for peptides containing only phenylalanine.
Does a high A280 value mean high peptide purity?
No. Other absorbing species, turbidity, or aggregates can raise the reading. Purity requires a suitable separation and identification strategy.
Should reduced and oxidized peptides use the same coefficient?
Not automatically. Cystine contributes differently from two free cysteines, and the structural change can also alter the local environment of aromatic residues.