
NAD+ vs NADH: Why Quenching and Extraction Define the Redox Measurement
NAD+ and NADH are paired redox cofactors, but their measured ratio can shift during sample collection and extraction. Metabolism continues after sampling unless cells or tissues are quenched quickly, and the cofactors can degrade or interconvert under unsuitable conditions. A defensible result therefore needs the individual NAD+ and NADH values, a defined extraction method, and evidence that the procedure preserves both analytes in the matrix being studied.
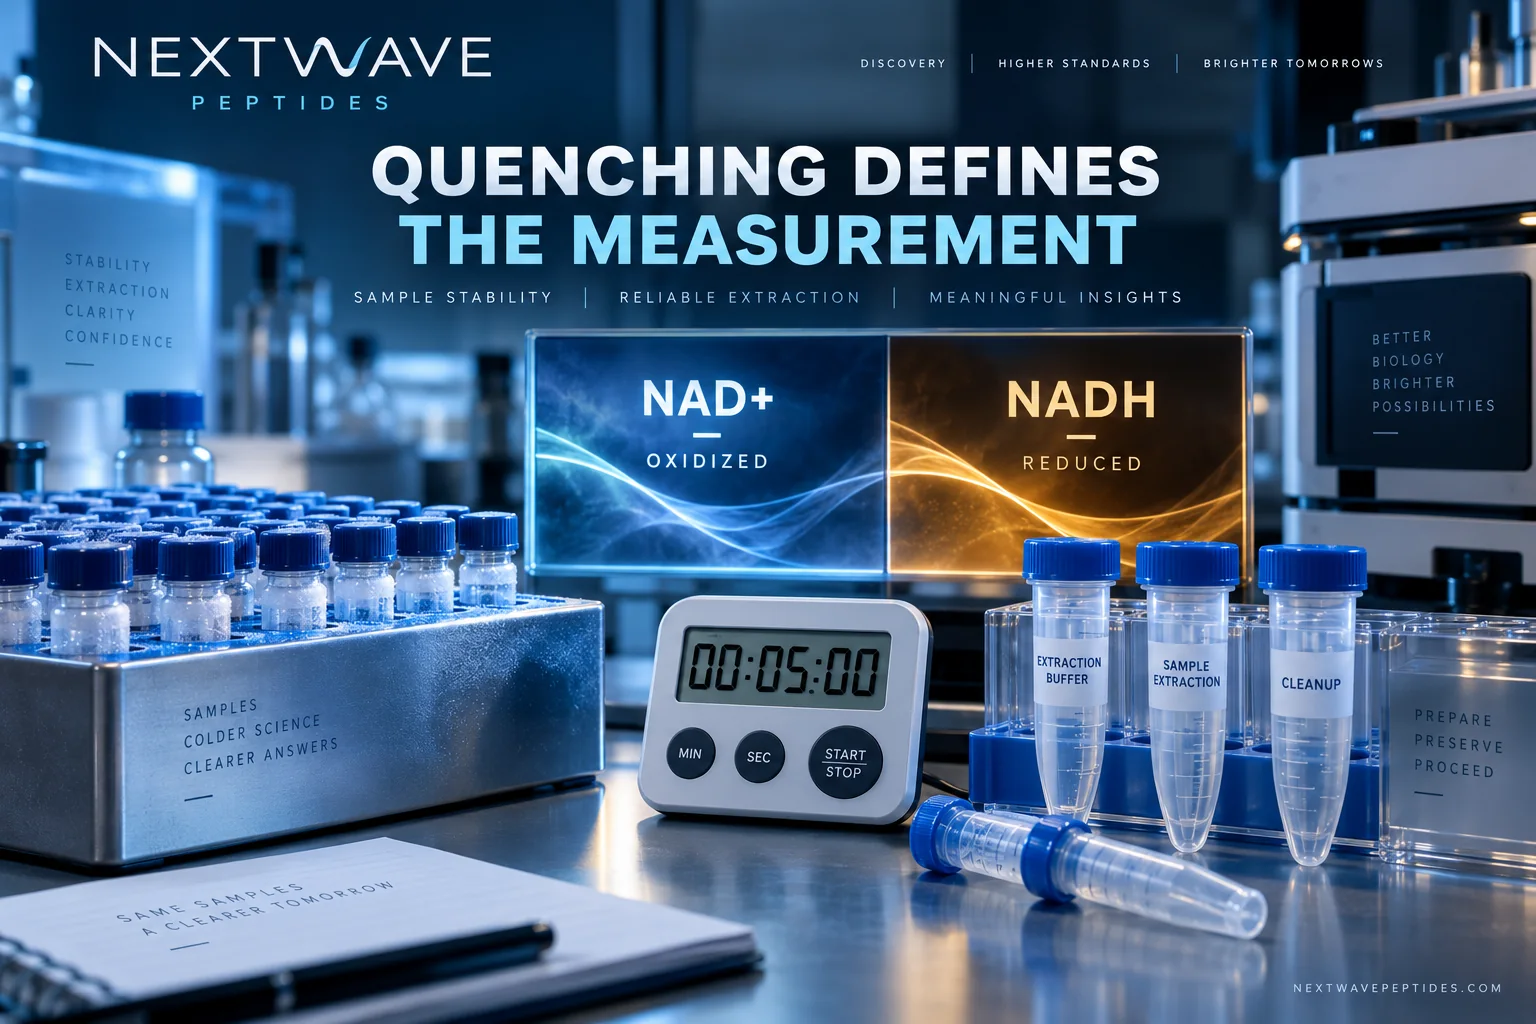
The NAD+ product page identifies a listed research material. It does not report the intracellular NAD+/NADH state of an experimental system. Product identity, biological extraction, and redox interpretation are separate records.
What does the NAD+/NADH ratio represent?
NAD+ is the oxidized form and NADH is the reduced form. Their relationship participates in many enzyme reactions, but a bulk extract combines signals from different compartments and metabolic processes. When comparing NAD+/NADH ratios across studies, check whether they measure total or free cofactors, which cellular compartments are included, and how the ratio is calculated.
A yeast method study developed a single extraction protocol under cold, nitrogen-saturated conditions and evaluated simultaneous recovery of NAD and NADH. The NIH PubMed: NAD/NADH extraction protocol illustrates why oxygen exposure, temperature, protein precipitation, and recovery steps are part of the measurement rather than administrative details.
| Workflow choice | Why it matters | What should be reported | Failure pattern |
|---|---|---|---|
| Sampling delay | Enzymes can continue consuming or producing cofactors | Time from collection to quench | Ex vivo change mistaken for biology |
| Quench temperature | Cooling slows reactions | Temperature and handling sequence | Variable results across operators |
| Extraction chemistry | NAD+ and NADH differ in stability and recovery | Solvent, pH, volume, and duration | Selective loss of one form |
| Internal standards | Tracks extraction and instrument variability | Standard identity and addition time | Apparent changes caused by recovery |
| Calibration | Defines quantitative range | Matrix, range, weighting, and limits | Ratio dominated by a poorly measured analyte |
| Normalization | Changes the biological denominator | Protein, cells, tissue mass, or volume | Incomparable units between groups |
Why one combined “NAD” result is insufficient
Total NAD can be useful for some questions, but it cannot reveal whether a change came from NAD+, NADH, or both. The ratio can also move dramatically when the lower-abundance analyte changes slightly. Reports should provide individual concentrations and uncertainty before presenting a ratio.
Enzymatic cycling and LC-MS methods have different strengths. Cycling assays can amplify signal but may depend on selectivity of the coupled enzymes and sample cleanup. LC-MS can separate multiple members of the NAD metabolome, yet ion suppression, in-source fragmentation, and standard stability need control. A NIH PubMed: NAD+ metabolome LC–MS/MS method was developed specifically because NAD-related cofactors are unstable and biological matrices differ.
General metabolomics work has shown that extraction can create systematic error through metabolite interconversion. The NIH PubMed: metabolite-measurement pitfalls demonstrates that quench composition can preserve or distort redox cofactors. This supports a practical rule: a commercial kit or published solvent is not automatically fit for every sample type.
Keep redox measurements separate across systems
The GSH versus GSSG guide addresses a parallel thiol-redox problem, but glutathione chemistry and NAD chemistry require different stabilization strategies. The LC-MS sample-preparation article shows how adsorption and extraction recovery can alter peptide signals. Both are useful analogies, not substitute methods.
Use the research literature-matrix workflow to record matrix, compartment, quench, extraction, detector, calibration, normalization, and time point. Within the Research Compounds collection, NAD+, glutathione, mitochondrial peptides, and small-molecule tools remain different materials even when studies discuss cellular metabolism.
What should a reproducible NAD redox report contain?
Report the biological matrix and amount, exact time to quench, temperature, oxygen-control steps, extraction pH and solvent, centrifugation conditions, storage duration, and freeze-thaw history. Name the analytical method and distinguish NAD+, NADH, NADP+, and NADPH rather than using “NAD” loosely.
Include individual values, ratio formula, units, recovery or process controls, and limits of quantitation. If NADH is close to the lower limit, state that uncertainty because the ratio may become unstable. Lot documentation in the COA library can support a supplied material’s reported identity or purity fields, not a biological sample’s redox state.
Research limitations
Extraction performance is matrix-specific. A protocol validated in yeast, cultured cells, plasma, or tissue should not be transferred without recovery and stability tests. Bulk NAD+/NADH measurements do not resolve subcellular compartments or the free cofactor ratio at a particular enzyme. This article concerns analytical interpretation, not human use or treatment effects.
Frequently asked questions
Is NAD+ the same as NADH?
No. NAD+ is oxidized and NADH is reduced. They are linked by redox reactions but require distinguishable measurements.
Can delayed freezing change the ratio?
Yes. Continued enzyme activity and chemical instability can change one or both analytes before extraction.
Is total NAD enough to describe redox state?
No. Total amount can stay similar while the distribution between NAD+ and NADH changes.
Can a product COA report intracellular NAD+/NADH?
No, unless it explicitly tests that biological sample and measurement. Routine lot identity or purity fields answer a different question.